


This week: US500 &NAS100
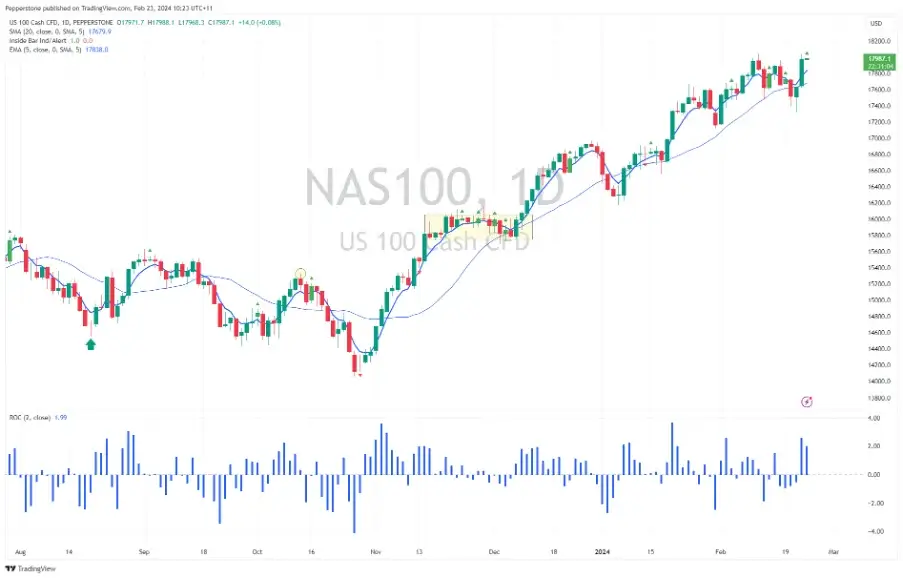
- S&P500 has grown since December ~80% of the time since 1950
- "Santa Rally": last week of December + 2 days of January
- US data (Q3 GDP, bids) may impact markets
- Low November inflation Inflation raises hopes of interest rate cuts
- Important dates: December 23rd GDP, December 24th Applications, December 25th December – closed
December is historically one of the strongest months for the S&P500: The index has delivered positive returns almost 80% of the time since 1950.
In addition to the holiday rally, U.S. stocks may be influenced by key data, including the delayed U.S. GDP report and many other indicators. With U.S. inflation unexpectedly falling in November, more data supporting rate cuts could support U.S. stocks in the final weeks of 2025.
Event calendar:
US GDP – US500
A weaker-than-expected U.S. GDP report could bolster the case for lower interest rates in the first quarter of 2026. Traders are now pricing in about a 23% chance the Fed will cut rates in January. The chance of a rate cut in March is about 42%.

US Initial Unemployment Claims - NAS100
US markets close early on Christmas Eve, but claims data could see a final bout of volatility.Signs of a weakening labor market could give the NAS100 further lift.
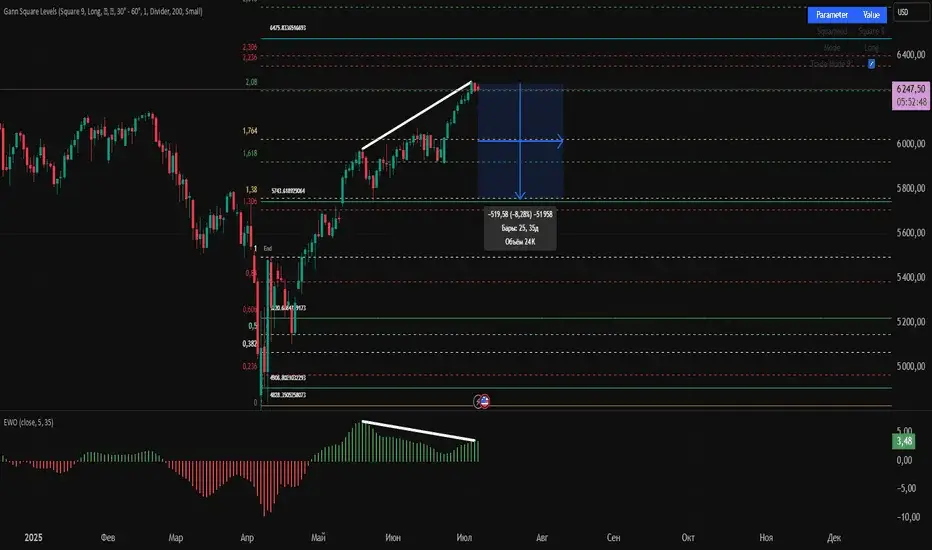
So in July the price slightly did not reach the lower limit of the zone (6500-6900), from which I expected a downward reaction. It all started a little earlier. First of all, you should pay attention to the fact that the beginning of the month is below the growth potential line (upper, dotted line). According to my strategy, this can be the beginning of a corrective wave or its conclusionan upward wave.Therefore, now you need to be prepared for the scenario of a market relief of at least 5-10% and a maximum of 25-30%.This period can last on average for several months, in case of negativity even up to a year (of course with the formation of 3-5 waves of theCorrection cycle).
PositiveScenario
1) You need to see the reaction to touching zone 5800 - 6000 (during the next local correction). If there is an upward recovery from here, it will be possible to create a new line of growth potential, which will allow us to determine the moment at which it will be possible to trade the short setup and reduce long positions.
2) According to wave analysis after the ATN update, we are still in an active growth wave. The scope for an increase remainsup to the values indicated in the previous review.Could the decline begin earlier?Perhaps.But in this situation, reaching the indicated grades will still be relevant, just before that we will see a test of the zone according to point 1.
3) The volumes of buyers are starting to fall, but still look convincing.Do not forget that trading away from highs with increased risksis connected.
NegativeScenario
1) Due to the ATN update, the 3-wave correction structure was canceled. To calculate the decline, the price must changenow consolidate below 5800-6000 (ideally with a test from below and a recovery in the same direction).
2) The opening price of the month was below the growth potential line (upper, dotted line). According to my strategy, this can indicate the beginning of a corrective wave or the completion of an upward wavepoint out.
3) Buyer volumes are starting to fall, but buyers still dominate.
4) Signs of divergence in indicators are emerging, which may also indicate the beginning of the market transitiona downward structure.
Result: My plan has not changed since the last check. I will not cancel the orders, but underTaking into account the new data, I will open shorts for a small amount on Monday. If the price rises, that's good, the volume will be achieved, and if it immediately falls, that's also good - I'm capable. The main goals will be in the first scenario, i.e. i.e.this is a decline of 5-10%.When these marks are reached, I will leave 10% of the position for the second scenario, with the price moving around 25-30%.
At the same time, I will select places to buy the drawdown into the long position both by index and by individualCompany.
Follow the reviews for the index distribution and the places where I record positionsmiss!
Thank you for your likes (rockets) and comments. They motivate me to continue writing reviews for you. If you like them and find them useful, don't forget toSubscribe!
Wins for everyone!
Other articles

5 Things to Know Before the Stock Market Opens
Stock futures are pointing to a higher open Thursday amid a chip stock rally, while investors also

Vexl: Empowering Peer-to-Peer Bitcoin Exchange Through Social Networks
In an era where centralized exchanges dominate cryptocurrency trading, Vexl stands out as a

The head of the Czech central bank urged not to equate Bitcoin with other crypto assets
Ales Michl published his opinion on Bitcoin amid the LIBRA scandal. The head of the CNB believes

The Bitcoin Pi Cycle Top Indicator: How to Accurately Time Market Cycle Peaks
The Bitcoin Pi Cycle Top Indicator has gained legendary status in the Bitcoin community for its